
Measuring PR is much more than simply illustrating success, it’s also about insights and recognising areas of strength and weakness.
“If we could change the conversation on measurement from ‘proving your value’ to getting better results, measurement would be more widely adopted”
– Dr. David Rockland (Chairman, Ketchum Global Research & Analytics; former Chairman of AMEC)
When we began developing our PR measurement solution – Acebook – we wanted to create a cohesive environment in which our user’s could easily analyse and compare the outputs and out-takes of their campaign.
Amongst the bespoke and preconfigured metrics a user can apply to their report, the Paid, Earned, Shared, Owned (PESO) model was an intrinsic integration, helping PRs measure fully integrated campaigns by channelling content according to type and tracking the impact and engagement achieved for each. More importantly, we allow user’s to collect this data over long stretches of time, so they may compare data sets for any specified time period e.g. month-on-month, year-on-year. By segmenting outputs and out-takes in this way, it becomes easier to identify patterns and strengths in performance.
Furthermore, by placing the communication measurements key to a campaign on a single dashboard (Acebook’s unique ‘Analysis’ page), it becomes far easier to evaluate methods and strategies.
By examining Acebook’s PESO graphs, we can quickly identify peaks and troughs in the campaign performance, thereby allowing us to better assess and understand key areas of strength and weakness. For example, the graphs below illustrates a peak in earned, owned and shared content during the month of March.
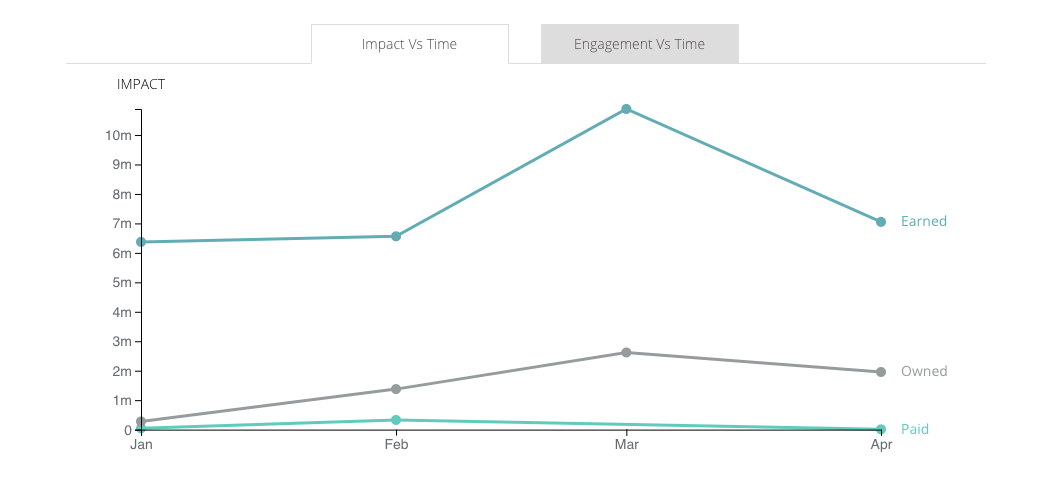

Utilising this information, it’s possible to cross-reference these peaks and troughs with any outcomes being mapped (e.g. conversions), to see whether they mirror this pattern.
By applying Acebook’s dynamic date filter, it is possible to dig deeper into the data and discover precisely what happened during this period to cause the peak in impact.
Looking at these results, it is easy to distinguish the high performing metrics from the low performing metrics. For example, in this report it’s easy to see that the greatest impact was attributed to a single online media outlet, whilst the least impact was generated by a Twitter post.
To delve deeper, we can view the individual pieces of content and extract further quantitative and qualitative data…

Beyond the impact, we can now see that the content was also favourable since the tone is ‘positive’, and that the editorial was informative by nature. Furthermore, the digital impact (SEO) was also positive; the site has an excellent domain authority and it incorporated two backlinks, one of which was followed. Read more about backlinks HERE
Utilising this information to evaluate your campaign outputs and out-takes in this manner, will help you address what’s aiding, hindering or having no effect on your campaign objectives, thereby enabling you to make an informed judgment on future planning and implementation.
Find out how Acebook can improve PR measurement by organising an online demo today CLICK HERE
