You’ve secured your coverage, attained the clipping or URL, now what… collate them into a coverage book? To date, this has been a time-honoured method of reporting successes to the client. However, with increasing demand on PRs to deliver on Key Performance Indicators (KPIs) and demonstrate Return on Investment (RoI), does the coverage report really cut it?
Broken down, what does a coverage report really tell the person for whom it’s intended? Let’s face it, the publication title and clipping alone don’t provide any significant evidence of what’s been achieved; it merely provides a tenuous overview of tangibles.
‘Lots of clippings laid out in your report can look great upon first glance, but when presented without assessment and analysis it lacks context’
Until recently, PRs have adopted a crude approach of applying Advertising Value Equivalents (AVEs) – where the ‘measurement’ is nothing more than the number of column inches cross-referenced with the respective publications’ rate card. But to even compare advertising with editorial is in itself a big mistake, but that’s a topic for another post! #DitchAVEs #SayNoToAVEs
If we add the data into the mix – circulation, readership, unique views and visits, social shares, etc – a vague picture begins to emerge. Standalone, this coverage report still represents nothing more than mere vanity. For the report to truly cut the grade, you need to dig deeper.
Assessment and analysis
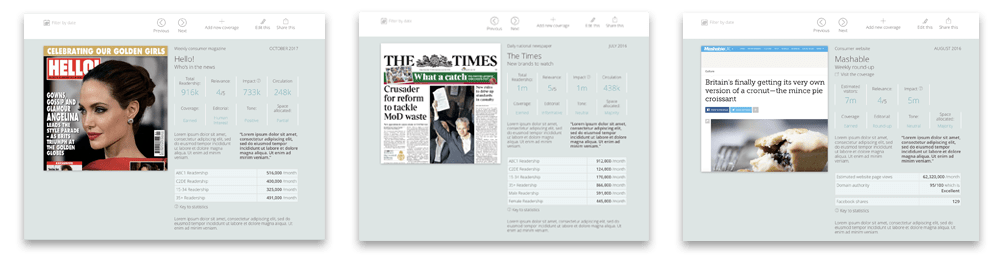
Lots of clippings laid out in your report can look great upon first glance, but when presented without assessment and analysis it lacks context. There’s no way of knowing which articles were impactful, positive/negative, or whether they’re being read by the target audience.
First, you need to assess the coverage. Start by identifying the coverage according to type – was it Paid, Earned or Owned; now define the tone of the coverage – was it positive, negative or neutral; how much space was afforded to the content, how many brand/product mentions; was it shared on social channels, if so which channels and how many times? Finally, you need to analyse the relevance.
Let’s imagine you’re publicising a skincare brand whose target audience consists women, aged 25yrs+, from an AB demographic group. You’ve successfully attained coverage within a popular lifestyle magazine, however, when you study the demographic breakdown of the readership, you discover only a small proportion of its readers are within the target age and demographic group. Of course, this doesn’t render the coverage entirely meritless, but it does diminish its impact on your campaign goals.
Relevance is one of the key indicators when analysing the data and it will help you identify the true reach, and ultimately, the impact of the campaign, but it will require some number drilling.
Once you’ve done this, you’ll not only have a display of clippings and data but you’ll also have useful insights on the impact and reach of the coverage, and ultimately, something that’s worthwhile presenting to your client and stakeholders.
The only pitfall is the process of collating, assessing and analysing can be extremely time consuming.
Some good news…
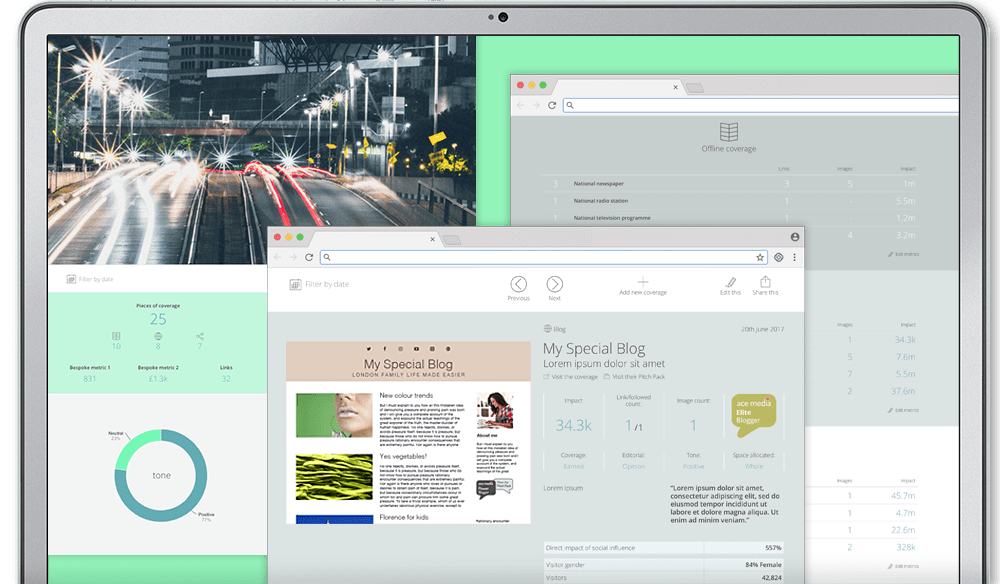
There’s no longer any need to agonise over the metrics and subsequent data crunching, Ace Media has a cutting-edge tool that takes care of that for you!
Through a range of quantitative and qualitative output measurements unique to Acebook, you can quickly build a full assessment for each individual piece of coverage; essential for comprehensive coverage reporting. This intuitive PR tool interprets this information and delivers an impressive, digestible presentation which can be shared with clients and team members digitally or via PDF.
Acebook provides data for online and offline media outlets, including:
OFFLINE (e.g. newspapers, magazines, radio)
Circulation
Readership
Listenership
ONLINE (e.g. websites, blogs, social channels)
Page views
Unique visits
Domain authority
Links / Followed Links
Follows, Shares and Interactions
VIRAL IMPACT
Acebook captures the viral effect on your online coverage:
Twitter – Counts of coverage re-tweets and favourites
Facebook – Counts of coverage shares, comments and reactions
Pinterest – Saves and comments
Best of all it saves you stacks of time!
Find out how Acebook can improve PR measurement by organising an online demo today – demo@ace.media